Halo effects between revenue channels
Clients ask for a “halo study” when a new revenue channel starts to matter and they suspect it moves sales somewhere else. AMMM3 does not estimate halo as a model feature. This note explains why, separates the request into four distinct estimands, and sets out the designs that answer each one, ranked by the evidence they can support.
The worked example uses the released PanelMMM surface with one model per
outcome. It does not add interaction terms, cross-channel parameters or a new
model type.
Why the request arrives now
Social commerce channels such as TikTok Shop sell inside the platform that also carries the advertising. A brand can see TikTok Shop revenue rise while Amazon, direct-to-consumer (DTC) and retail revenue also move. The client wants to know whether TikTok activity caused those other movements, whether it took sales from them, or whether the attribution is simply landing in the wrong place. All three questions get called halo.
The same pattern appears with marketplace launches, retail media networks and any channel that is both a medium and a point of sale. The estimand problem is general; TikTok Shop is the current trigger.
The request is usually underspecified
Requests for halo work tend to be short. Common phrasings:
- “Can you show the halo from TikTok onto Amazon?”
- “We think TikTok is lifting everything else. Can the model prove it?”
- “Finance says TikTok Shop is just cannibalising DTC. Is that true?”
- “Amazon revenue is up but Amazon ads did not change. Is that TikTok?”
Each sentence points at a different causal question, a different outcome series and a different treatment variable. The client often has not decided which one they mean, and the phrasing does not force them to. “Halo” is a label for an expected positive spillover; it is not an estimand.
Vague motivation compounds the problem. The request may come from a channel owner defending a budget, a finance team suspecting cannibalisation, or a platform partner supplying a favourable case study. Each has a preferred answer. If the estimand is left open, the analysis will drift towards whichever result is easiest to produce and hardest to refute.
Before any modelling, resolve the request into one of the four designs below.
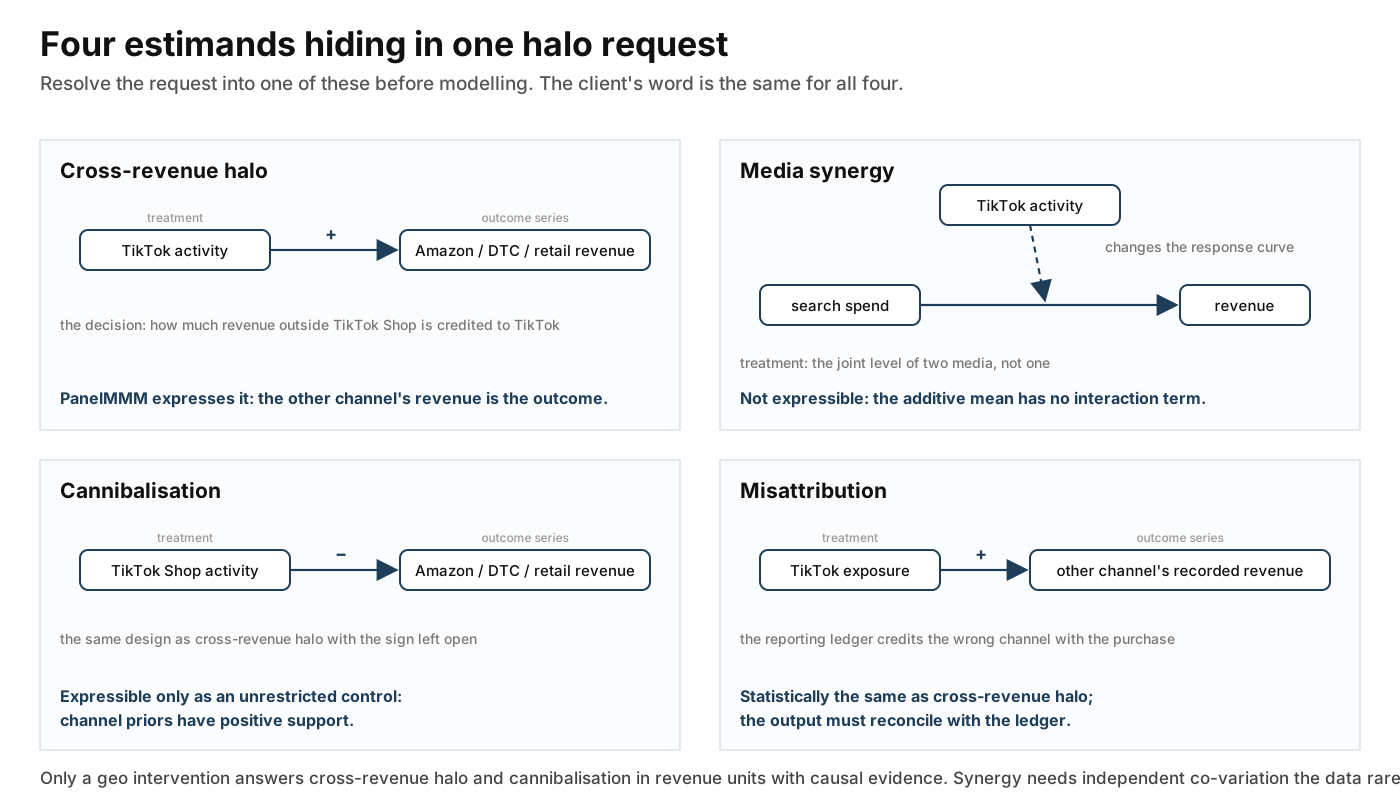
1. Cross-revenue halo
TikTok Shop activity causes additional sales on Amazon, DTC or retail.
| Element | Definition |
|---|---|
| Causal question | Does TikTok activity increase revenue in a different sales channel? |
| Outcome series | Amazon, DTC or retail revenue, one series per channel |
| Treatment variable | TikTok media spend, impressions, or TikTok Shop activity |
| Sign of interest | Positive |
| Confused with | Cannibalisation (same outcome series, opposite sign) |
The decision this informs is whether TikTok budget should be credited with revenue that lands outside TikTok Shop, and by how much.
2. Media synergy
TikTok advertising makes another paid medium more effective. Search response per unit of search spend is higher when TikTok activity is high.
| Element | Definition |
|---|---|
| Causal question | Does the response curve of one medium depend on the level of another? |
| Outcome series | Total revenue or a chosen revenue channel |
| Treatment variable | The joint level of two media, not one |
| Sign of interest | Positive interaction |
| Confused with | Cross-revenue halo (single medium, single outcome) |
This is a question about the shape of the response surface, not about where revenue lands. It requires independent co-variation in the two media and is the hardest of the four to identify from observational data.
3. Cannibalisation
TikTok Shop takes sales that would otherwise have occurred on Amazon, DTC or retail. Total revenue is unchanged or rises less than TikTok Shop revenue.
| Element | Definition |
|---|---|
| Causal question | Does TikTok Shop activity reduce revenue in another sales channel? |
| Outcome series | Amazon, DTC or retail revenue |
| Treatment variable | TikTok Shop activity or availability |
| Sign of interest | Negative |
| Confused with | Cross-revenue halo (same design, opposite sign) |
Cross-revenue halo and cannibalisation are the same estimation problem with the sign left open. A design that constrains the effect to be positive cannot detect cannibalisation.
4. Misattribution
Sales that appear on Amazon or DTC were caused by TikTok exposure. The reporting system credits the wrong channel because the purchase happened elsewhere.
| Element | Definition |
|---|---|
| Causal question | How much of another channel’s recorded revenue is incremental to TikTok exposure? |
| Outcome series | The other channel’s revenue |
| Treatment variable | TikTok exposure |
| Sign of interest | Positive |
| Confused with | Cross-revenue halo |
Statistically this is cross-revenue halo. The difference is operational. The client wants to correct an attribution ledger, so they need an estimate in revenue units for a specific period, and they need it reconciled against platform-reported figures. A conditional model contribution will not settle a dispute between attribution systems unless the client agrees in advance how it will be used.
Questions to put to the client before modelling
- Which revenue series is the outcome? TikTok Shop revenue as the outcome cannot answer any of the four questions.
- What is the treatment? TikTok media spend, impressions, Shop availability and Shop revenue are different variables with different causal roles.
- Is a negative answer acceptable? If the design must allow cannibalisation, the effect cannot be constrained to positive support.
- Over what period and at what granularity? Weekly national totals often contain fewer independent movements than the row count suggests.
- What will the client do differently depending on the answer? If no decision changes, the study is a reporting exercise and should be scoped as one.
Record the answers. They define the estimand, and they are the reference against which the eventual claim is judged.
What AMMM3 estimates by construction
PanelMMM builds an additive mean in scaled target space:
mu = intercept
   + sum over channels of saturation(adstock(channel spend))
   + sum over controls of control * gamma_control
   + optional seasonality, trend, events and other additive effects
Each channel passes through its own adstock and saturation. The transformed channels are summed. There is no term whose value depends on two channels at once. Changing TikTok spend does not change the search coefficient or the search saturation curve.
compute_incrementality(...) records this as additive_channel_response: True in its metadata. Because each channel’s contribution depends only on its
own spend, a joint intervention across all channels equals the sum of the
corresponding unilateral interventions. Saturation curves the response to a
channel’s own spend; it does not create a gap between the joint result and the
sum of its parts. Any intuition that cutting two channels together differs
from cutting each alone has no expression in this model.
Two further properties matter for halo designs.
Media channel contributions are non-negative by construction. Saturation
beta priors default to HalfNormal. A variable entered as a channel cannot
carry a negative coefficient, so it cannot represent cannibalisation.
Controls are unrestricted by default. gamma_control defaults to
Normal(0, 2) and control_impacts accepts "unrestricted",
"positive" or "negative". Controls are not scaled automatically and do
not pass through adstock or saturation.
A panel dimension such as brand or revenue_channel indexes separate
outcome series. Each row carries its own media. Brand A’s rows do not contain
brand B’s spend, so the model excludes cross-brand effects by construction
unless you copy the other channel’s activity onto the row as a regressor.
| Estimand | Estimated by PanelMMM today? | Reason |
|---|---|---|
| Cross-revenue halo | Only if the other channel’s revenue is the outcome and TikTok activity is a regressor | Additive model, one outcome per fit |
| Media synergy | No | No interaction term in the mean |
| Cannibalisation | Only as above, with TikTok activity as an unrestricted control | Channel priors have positive support |
| Misattribution | Same as cross-revenue halo | Same estimand, different use of the result |
Design options ranked by evidential value
Claim classes follow the Agency Workflow table.
Option A: geo intervention with other-channel outcomes
Reduce or withhold TikTok advertising in a set of geographies for a fixed period. Measure Amazon, DTC and retail revenue in treated and control geographies. Analyse the contrast with the design’s own method, such as a pre-registered difference-in-differences or a matched-market comparison with stated assumptions.
The treatment is the advertising, not TikTok Shop itself. Shop availability usually cannot be varied by geography, and the client’s question concerns exposure in any case. Treat Shop activity as a downstream consequence of the advertising rather than as the intervention. Geographies are the assignment unit; stores can serve as outcome units where store-level revenue exists, but they cannot be assigned independently because they sit inside geographies.
Claim class: causal evidence for that intervention, population and period.
This is the only option that answers cross-revenue halo and cannibalisation in revenue units with an argument a sceptical client will accept. It requires geo-level control of TikTok advertising and geo-level revenue for the other channels.
The lift estimate can be used as external evidence for the time-series
PanelMMM path through add_lift_test_measurements(...). Named FE and CRE
do not support calibration. Calibration does not extend the causal claim to
untested geographies, dates or spend ranges.
Option B: one model per outcome
Fit a separate PanelMMM for each other-channel revenue series. Use that
channel’s own media as channel_columns. Enter TikTok activity as a
standardised unrestricted control. Report the TikTok coefficient’s posterior
sign and interval as a conditional model allocation.
Claim class: conditional model result.
This is the best observational use of AMMM3 for the question. It runs on the released surface and needs no new code. It does not identify the effect. The usual threats apply and are often severe here: TikTok activity co-moves with paid social, promotions, seasonality and platform-driven demand. Report the sensitivity of the coefficient to those controls rather than treating one specification as the answer.
A panel version is possible by stacking the outcome series under a
revenue_channel dim and copying TikTok activity onto every row. This note
uses one model per outcome because it keeps the identification argument
visible and avoids implying that the dimension carries cross-channel
structure.
Option C: interaction terms
Add a term such as f(TikTok) * g(Search) to the mean. This addresses media
synergy only. It does not address where revenue lands.
Claim class: conditional model result, and a weak one without independent co-variation.
AMMM3 does not build this term. It would be a custom MuEffect. The costs
are specific:
- named FE and CRE reject custom additive effects
compute_incrementality(...)rejectsmu_effects- budget optimisation, ROAS and contribution decomposition assume additive channel response and will not interpret the interaction
Interaction terms are also poorly identified when the two media are planned together, which is the normal case for TikTok and paid social. Do not add them to satisfy a halo request. Add them only when the client’s question is synergy and the data contain independent variation in both media.
Worked example: one model per outcome
The example generates synthetic weekly data with a known positive effect of
TikTok activity on Amazon revenue. It fits Amazon revenue as the outcome, uses
two Amazon media channels as channel_columns, and enters standardised TikTok
activity as an unrestricted control. It then repeats the fit on a dataset in
which TikTok activity co-moves with one of the Amazon channels.
import arviz as az
import numpy as np
import pandas as pd

from abacus.mmm import GeometricAdstock, LogisticSaturation
from abacus.mmm.panel import PanelMMM


def make_dataset(rho: float, seed: int = 7, n_weeks: int = 156) -> pd.DataFrame:
    """Return weekly Amazon revenue with a known TikTok effect.

    ``rho`` is the target correlation between TikTok activity and
    ``amazon_search`` spend. Use 0.0 for independent variation and 0.8 for
    the co-movement case.
    """
    rng = np.random.default_rng(seed)
    dates = pd.date_range("2023-01-02", periods=n_weeks, freq="W-MON")
    amazon_search = rng.gamma(shape=4.0, scale=25.0, size=n_weeks)
    amazon_display = rng.gamma(shape=3.0, scale=20.0, size=n_weeks)
    noise = rng.normal(size=n_weeks)
    search_z = (amazon_search - amazon_search.mean()) / amazon_search.std()
    tiktok_z = rho * search_z + np.sqrt(1 - rho**2) * noise
    halo = 400.0  # revenue units per standard deviation of TikTok activity
    revenue = (
        5000.0
        + 12.0 * np.sqrt(amazon_search)
        + 8.0 * np.sqrt(amazon_display)
        + halo * tiktok_z
        + rng.normal(scale=300.0, size=n_weeks)
    )
    return pd.DataFrame(
        {
            "date": dates,
            "amazon_search": amazon_search,
            "amazon_display": amazon_display,
            "tiktok_activity_z": tiktok_z,
            "amazon_revenue": revenue,
        }
    )


def fit_amazon_model(dataset: pd.DataFrame) -> PanelMMM:
    """Fit Amazon revenue with TikTok activity as an unrestricted control."""
    X = dataset.drop(columns=["amazon_revenue"])
    y = dataset["amazon_revenue"].rename("amazon_revenue")
    mmm = PanelMMM(
        date_column="date",
        target_column="amazon_revenue",
        channel_columns=["amazon_search", "amazon_display"],
        control_columns=["tiktok_activity_z"],
        control_impacts={"tiktok_activity_z": "unrestricted"},
        adstock=GeometricAdstock(l_max=4),
        saturation=LogisticSaturation(),
    )
    mmm.fit(
        X,
        y,
        draws=500,
        tune=500,
        chains=2,
        cores=2,
        progressbar=False,
        compute_convergence_checks=False,
        random_seed=42,
    )
    return mmm


def tiktok_coefficient(mmm: PanelMMM) -> tuple[float, float, float]:
    """Return the posterior mean and 94% HDI of the TikTok control coefficient."""
    gamma = mmm.idata.posterior["gamma_control"].sel(control="tiktok_activity_z")
    hdi = az.hdi(gamma, hdi_prob=0.94)["gamma_control"].values
    return float(gamma.mean()), float(hdi[0]), float(hdi[1])


independent = fit_amazon_model(make_dataset(rho=0.0))
comoving = fit_amazon_model(make_dataset(rho=0.8))

print("independent variation:", tiktok_coefficient(independent))
print("co-moving with search:", tiktok_coefficient(comoving))
gamma_control is reported on the scaled target scale. The target is
max-abs scaled by default, so multiply by the target scale to recover revenue
units. Compare the sign and the interval width across the two datasets rather
than the point estimates alone.
The control is standardised in the generating code because AMMM3 does not scale controls. If TikTok activity is supplied in raw units, standardise it before fitting and record the transformation.
Why TikTok enters as a control
Entering TikTok activity as a control rather than a channel makes two choices explicit.
The coefficient is unrestricted. It can be negative, so the same fit can
detect cannibalisation. A channel would carry a HalfNormal saturation
beta and could not.
The regressor receives no adstock or saturation. If the client believes the cross-channel effect carries over several weeks, either supply a pre-computed lagged or smoothed activity series as the control, or enter TikTok as a channel and accept that the design then excludes cannibalisation by construction. State which choice was made and why.
What to inspect
Compare the two fits on these points.
| Check | Independent variation | Co-movement with search |
|---|---|---|
Posterior sign of gamma_control | Should recover the generating sign | May still recover the sign, with a wider interval |
| Interval width | Narrow relative to the mean | Wider; TikTok and search compete for the same variation |
amazon_search contribution | Stable | Shifts in the opposite direction to the TikTok coefficient |
Raw correlation between tiktok_activity_z and amazon_search | Near zero | Near 0.8 |
Run the raw correlation check on the real dataset before fitting. If TikTok activity co-moves with the outcome channel’s own media, the model will allocate the shared variation by prior and functional form, and predictive fit will not tell you which allocation is right. See Baseline and media trade-offs for the same problem between baseline and media, and Always-on and low-variance channels for the limiting case in which a channel supplies no variation of its own and the prior decides its contribution outright.
Fit the model with and without the TikTok control and report the change in the own-channel contributions. Fit it with and without paid social, promotion and seasonality controls and report the change in the TikTok coefficient. A coefficient that survives those comparisons is still a conditional result, but it is a better-supported one.
What the example does not establish
The synthetic data have a known effect because the generating code wrote it in. Real data do not. Recovering the sign in the example shows that the model can express the estimand; it does not show that a real TikTok coefficient is causal. Demand-led budget setting, shared campaign calendars, platform promotions and measurement changes remain threats.
Reporting language by claim class
Use sentences from the class the evidence supports.
Data description. “Amazon revenue rose 14% in the twelve weeks after TikTok Shop launched. TikTok media spend rose 60% over the same period.”
Conditional model result. “In a model of Amazon revenue with Amazon media, seasonality and price as covariates, standardised TikTok activity has a posterior mean coefficient of X with a 94% interval that excludes zero. This is the model’s allocation under those assumptions. It is not an identified causal effect.”
Predictive evidence. “Adding TikTok activity to the Amazon model improved blocked holdout error by Y%. Predictive improvement does not establish that the allocation to TikTok is correct.”
Causal evidence. “In a geo experiment that reduced TikTok media by 80% in eight of thirty regions for six weeks, Amazon revenue in treated regions fell by Z% relative to control, with a stated interval. This estimate applies to that intervention, period and set of regions.”
Decision recommendation. “Given the experimental estimate and its interval, crediting TikTok with a share of Amazon revenue in the range A to B is consistent with the evidence. Extending that credit to future periods or to other channels requires further testing.”
Do not report a conditional model coefficient as “the halo”. Do not report a positive coefficient from a design that could not have produced a negative one as evidence against cannibalisation.
Modelling synergy directly
Estimating media synergy inside the model would need an interaction term in the mean, priors for it, and changes to incrementality, optimisation and decomposition so that they interpret a non-additive channel response. AMMM3 does not build this and it is not planned. The one-model-per-outcome design and the geo intervention cover the revenue-channel questions clients usually mean by halo. Synergy is a separate question with a separate, and weaker, observational identification argument.