Contributions and Decomposition
AMMM3 stores additive contribution terms for fitted PanelMMM models and
exposes them through the data wrapper, summary tables, and plotting suite.
Use this page to inspect media, baseline, control, seasonality, and event effects. For channel efficiency ratios built from media contributions, see ROAS and Metrics.
Contribution surfaces
You can work with contributions at three levels.
| Surface | Use it for |
|---|---|
mmm.data | Raw xarray contribution samples |
mmm.summary | DataFrames with posterior means, medians, and HDIs |
mmm.plot | Time-series and waterfall visualisations |
Read raw contribution samples
The lowest-level accessor is mmm.data.get_contributions(...):
contributions = mmm.data.get_contributions(
    original_scale=True,
    include_baseline=True,
    include_controls=True,
    include_seasonality=True,
    include_events=True,
)
Depending on the fitted model, the returned dataset can contain:
channelsbaselinecontrolsseasonalityevents
baseline includes the intercept contribution and any legacy Mundlak
contribution when the fitted model uses use_mundlak_cre=True. For the named
CRE preset, the structured pipeline reports the CRE adjustment separately and
retains it on the baseline or non-incremental side of the decomposition.
For media-only contribution samples, use:
channel_contributions = mmm.data.get_channel_contributions(original_scale=True)
Summarise one contribution type
Use mmm.summary.contributions(...) when you want a tidy table with posterior
summary statistics:
channel_df = mmm.summary.contributions(
    component="channel",
    hdi_probs=[0.80, 0.94],
)
Supported component values are:
channelorchannelscontrolorcontrolsseasonalitybaseline
The returned table includes:
- identifying columns such as
date,channel,control, and any paneldims meanmedian- HDI bound columns such as
abs_error_94_lowerandabs_error_94_upper
mmm.summary.contributions(...) does not expose event effects. For event
effects, use mmm.data.get_contributions(include_events=True) or
mmm.summary.mean_contributions_over_time().
Create a wide decomposition table
Use mmm.summary.mean_contributions_over_time(...) when you want one row per
time point and panel slice:
decomposition = mmm.summary.mean_contributions_over_time(
    original_scale=True,
)
This table contains posterior means only. It widens the contribution data so that each retained component becomes a column.
Typical output looks like this:
| date | geo | TV | Search | baseline | seasonality |
|---|---|---|---|---|---|
| 2024-01-01 | UK | 1240.5 | 822.1 | 5110.7 | -95.4 |
| 2024-01-08 | UK | 1302.8 | 801.6 | 5076.9 | 22.7 |
When present, the wide table also includes:
- control columns
- event columns named from posterior variables that end with
_total_effect
Aggregate total contribution by component
Use mmm.summary.total_contribution(...) when you want one row per date and
component type after summing across individual channels or controls:
totals = mmm.summary.total_contribution(frequency="monthly")
This is useful when you want a component-level roll-up, for example total media versus baseline.
Inspect change over time
Use mmm.summary.change_over_time(...) for percentage change in channel
contributions between consecutive periods:
changes = mmm.summary.change_over_time(frequency="monthly")
This summary requires a date dimension. Do not use frequency="all_time".
Plot decomposition outputs
Use the plotting suite for visual inspection:
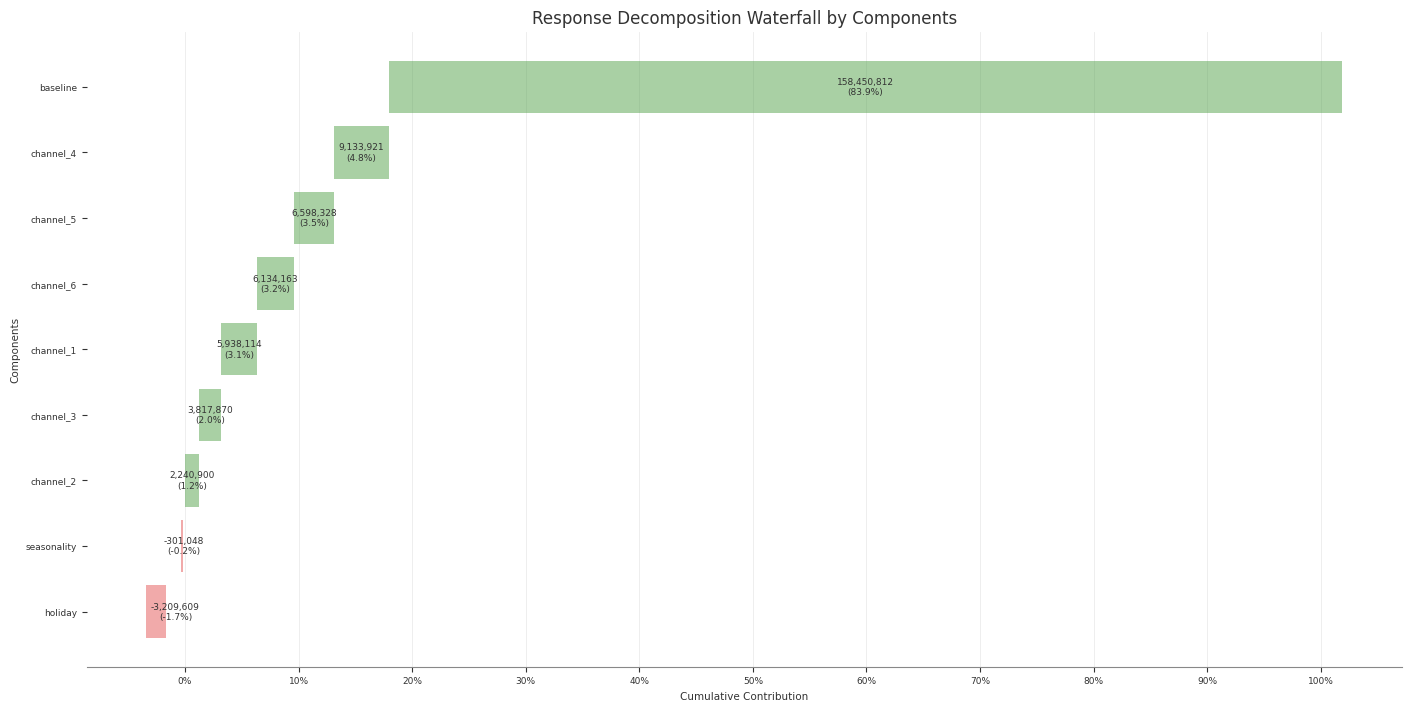
waterfall_figure, waterfall_axes = mmm.plot.waterfall_components_decomposition(
    original_scale=True,
)

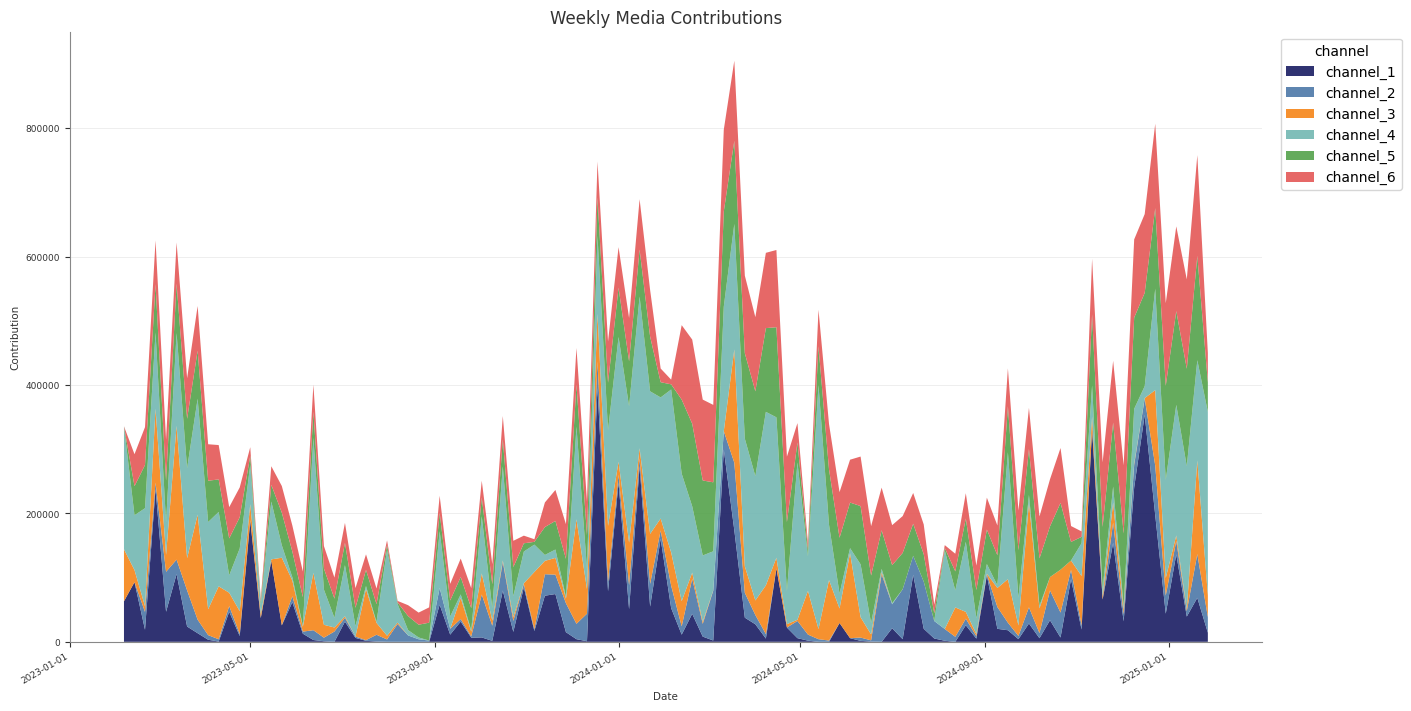
area_figure, area_axes = mmm.plot.media_contribution_over_time(
    original_scale=True,
)
Useful plotting methods are:
waterfall_components_decomposition(...)media_contribution_over_time(...)contributions_over_time(...)channel_contribution_share_hdi(...)
Example decomposition output:
Practical guidance
- Use
original_scale=Truewhen you want business-unit interpretation. - Use
mmm.summary.contributions(...)for tidy per-component tables. - Use
mmm.summary.mean_contributions_over_time()for decomposition exports. - Use
mmm.summary.total_contribution()when you only need component-level totals.
Common pitfalls
- Expecting
mmm.summary.contributions(...)to include event effects - Forgetting that
baselinecan include more than the intercept when legacy Mundlak CRE is enabled, or that the named CRE adjustment is non-incremental - Using
frequency="all_time"withmean_contributions_over_time()orchange_over_time()